
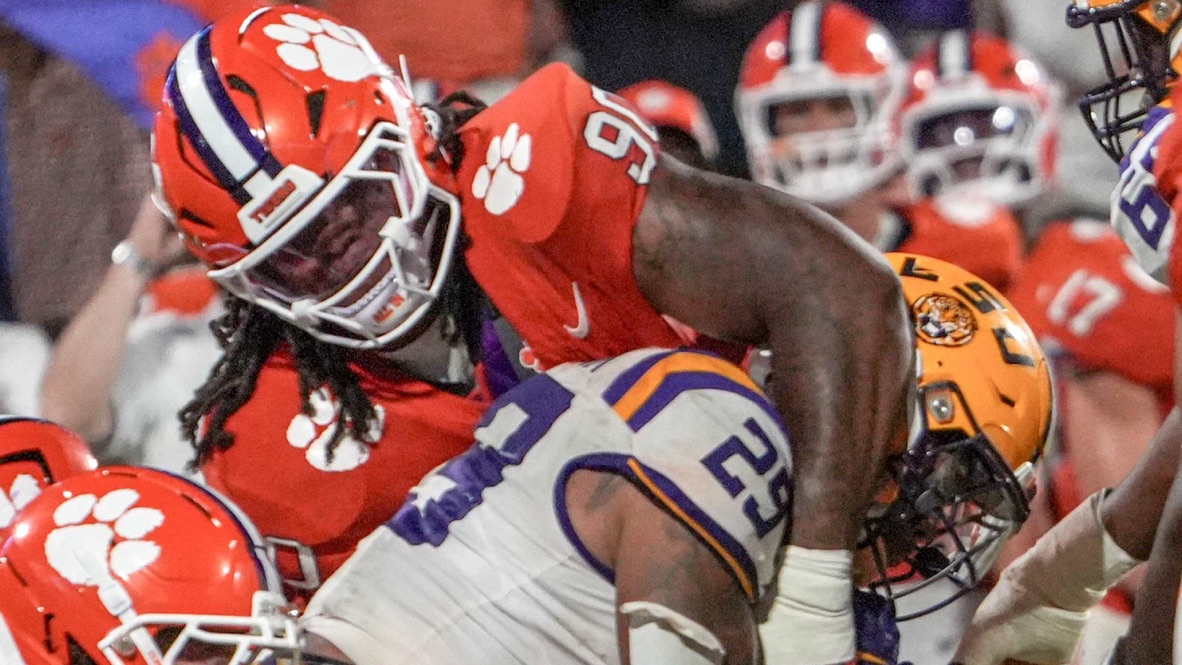
On paper, a marquee clash between Clemson and LSU promises high-flying action and elite power-five football. But a deeper dive into last season’s statistical profiles exposes underlying vulnerabilities on both sides of the ball. While surface metrics suggest a high-octane offensive battle, both coaching staffs have ample reason for extreme caution.
Last season, Clemson generated 386.9 yards per game (ranked No. 65 nationally) and averaged 25.8 points per contest (#71) on 0.369 points per play (#73). LSU’s offensive metrics were even more constrained, producing 317.8 yards per game (#116) and 20.1 points per game (#111) on 0.315 points per play (#104).
Despite Clemson’s functional air attack—averaging 270.3 passing yards per game (#21) with a 65.15% completion rate (#32)—their efficiency collapsed in critical situations. Clemson converted just 34.36% of its third downs, ranking a lowly No. 105 in the country. Their red-zone conversion rate was equally concerning, scoring on only 81.08% of trips (#89).
LSU struggled in many of the same key offensive categories, posting a 34.38% third-down conversion rate (#104) and a 78.95% red-zone scoring rate (#101).
The ground games for both programs presented major limitations last season:
- Clemson Rushing: Averaged 116.6 rushing yards per game (#111) at 3.7 yards per carry (#103) on 31.6 carries per game (#110).
- LSU Rushing: Managed only 102.1 rushing yards per game (#122) at 3.6 yards per carry (#106) on 28.3 carries per game (#132).
Defensively, both units demonstrated distinct strengths alongside noticeable pass-defense vulnerabilities. LSU’s defense allowed 20.7 points per game (#24) and 339.4 total yards per game (#28), holding opponents to 0.302 points per play (#24) and 5.0 yards per play (#32). LSU’s defense was particularly stout in the red zone, ranking No. 8 nationally by holding opponents to a 72.73% red-zone scoring percentage. However, LSU surrendered 212.5 passing yards per contest (#49) and ranked No. 84 in QB sack percentage (5.54%).
Clemson’s defense gave up 21.4 points per game (#33) and 364.5 total yards per game (#51) on 5.3 yards per play (#47), but excelled in opposing pass completion percentage (60.86%, #53) and allowed opponents a 42.31% fourth-down conversion rate (#23). Yet, Clemson struggled against the pass overall, yielding 255.6 passing yards per game (#120) and ranking No. 135 in opponent pass play percentage (57.04%).
Discipline and ball security further highlight why both teams must proceed carefully. LSU excelled in turnover margin at +0.6 per game (#19) and drew just 4.3 penalties per game (#13 for opponents) in contrast to Clemson’s 0.0 turnover margin (#67). On penalties, LSU committed 7.0 penalties per game (#103) for 60.1 penalty yards per game (#102), whereas Clemson proved far more disciplined, committing 4.3 penalties per game (#13) for 41.1 penalty yards per game (#23).
In special teams, Clemson held an edge in field goal conversion percentage at 84.21% (#28) compared to LSU’s 82.76% (#37).
With both sides navigating high turnover rates on third downs, inefficient red-zone execution, and notable pass-defense gaps, execution will dictate the outcome. Any misstep could quickly turn this high-stakes matchup into an early-season setback.


